

Key Takeaways
- CPL shows the cost of generating a lead, but it does not indicate whether those leads are qualified or will become customers.
- Track the full journey from Impressions, CTR, CPC, Leads, and CPL to Qualified Leads, CAC, and ROAS.
- Start with business goals and align advertising KPIs with lead quality, sales conversion, and business outcomes.
Meta ads metrics help marketers evaluate campaign performance beyond the number of leads generated. A campaign focusing on facebook lead generation can generate a large volume of leads while still producing limited business value if those leads are not relevant, cannot be contacted, or do not convert into customers.
For this reason, tracking Meta ads metrics for lead generation should be analyzed across the full journey—from ad performance to lead generation, lead quality, and customer conversion. This is particularly important for B2B campaigns, where sales cycles can be longer and lead quality is often more critical than lead volume alone.
What Are Meta Ads Metrics for Lead Generation?
Meta ads metrics for lead generation are the measurements used to evaluate how an advertising campaign performs, from ad visibility and engagement to clicks, leads, and downstream business outcomes. Facebook lead generation allows businesses to collect information from interested users directly through the platform and use those leads for further sales activities.
Metrics and meta ads kpis are related but serve different purposes. Metrics are data points used to monitor and analyze performance, such as Impressions, CTR, and CPL. KPIs, or Key Performance Indicators, are specific metrics selected because they tie directly to business goals—such as target CPL, Qualified Lead Rate, or CAC.
This distinction matters because a campaign can generate many leads without acquiring valuable customers. Lead generation performance should therefore be evaluated across cost, volume, quality, and business outcomes.
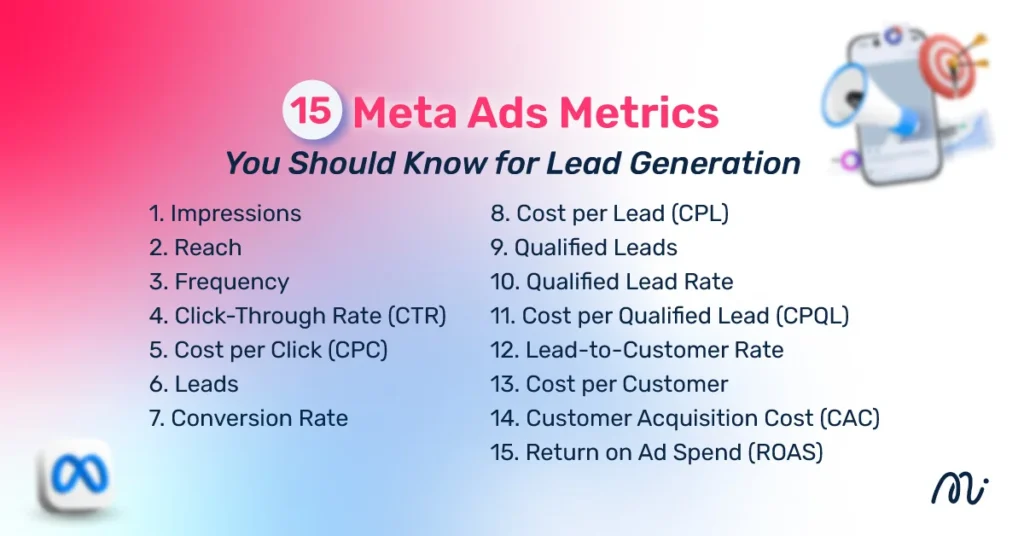
15 Meta Ads Metrics You Should Know for Lead Generation
1. Impressions
Impressions represent the number of times an ad is displayed. One person can generate multiple Impressions, so this Metric is useful for understanding the overall visibility of a Campaign and should be considered alongside Reach and Frequency.
2. Reach
Reach represents the number of people who saw an ad at least once. Unlike Impressions, which count total displays, Reach focuses on the number of unique people exposed to the ad. Comparing Reach with Impressions can help marketers understand how frequently the same Audience is being exposed to the Campaign.
3. Frequency
Frequency represents the average number of times each person sees an ad. A rising Frequency combined with declining CTR or Conversion Rate may indicate potential Ad Fatigue. When this pattern appears, marketers can review Creative, Audience Segmentation and Campaign Structure to identify possible causes.
4. Click-Through Rate (CTR)
Click-Through Rate, or CTR, measures the proportion of people who click an ad relative to the number of times it is shown. It is useful for evaluating whether the Creative, Message and Offer attract Audience attention. However, a high CTR does not automatically mean that the Campaign is generating high-quality Leads.
5. Cost per Click (CPC)
Cost per Click, or CPC, measures the average amount spent for each click. It can help marketers compare the cost of generating Traffic across Ads, Audiences and Campaigns.
CPC should still be analyzed alongside CTR, Conversion Rate and CPL because a low CPC does not necessarily translate into valuable Leads.
6. Leads
Leads represent the number of people who complete a defined Lead action, such as submitting a Lead Form or Website Form. This Metric measures Lead Volume, but it does not necessarily indicate Lead Quality. A Campaign can generate many Leads while producing relatively few Qualified Leads.
7. Conversion Rate
Conversion Rate measures the proportion of users or visits that result in a defined Conversion, depending on how the metric is configured. For Lead Generation, this may include actions such as submitting a Lead Form. If CTR is strong but Conversion Rate is low, marketers can review the Landing Page, Form, Offer or Conversion Experience.
8. Cost per Lead (CPL)
Cost per Lead, or CPL, measures the average advertising cost required to generate one Lead. CPL is one of the most commonly used Lead Generation Metrics, but it should not be treated as the only KPI. A low CPL can result from generating a large number of Leads that have limited relevance or low purchase intent.
9. Qualified Leads
Qualified Leads are Leads that meet predefined quality criteria established by the business. These criteria may include Audience Fit, need, budget, location, company size or other Sales requirements. The definition should be agreed upon by Marketing and Sales so both teams evaluate Lead Quality using consistent criteria.
10. Qualified Lead Rate
Qualified Lead Rate measures the proportion of total Leads that meet the business’s definition of a Qualified Lead. This Metric helps marketers understand whether a Campaign is generating useful Leads rather than simply increasing Lead Volume.
For example, Campaign A may have a lower CPL than Campaign B but a much lower Qualified Lead Rate. In this case, CPL alone would provide an incomplete view of Performance.
11. Cost per Qualified Lead (CPQL)
Cost per Qualified Lead, or CPQL, measures how much advertising Spend is required to generate one Qualified Lead. CPQL connects Cost with Lead Quality and can provide a more meaningful view of Campaign Performance when the primary goal is to generate Leads that Sales can actually work with.
12. Lead-to-Customer Rate
Lead-to-Customer Rate measures the proportion of Leads that eventually become Customers. This Metric connects Advertising Performance with Sales Outcomes and becomes especially valuable when a Campaign has a longer Sales Cycle.
13. Cost per Customer
Cost per Customer measures the average advertising cost associated with acquiring one Customer. Looking at Cost per Customer helps marketers understand what happens after a Lead is generated and provides a more complete view than CPL alone.
14. Customer Acquisition Cost (CAC)
Customer Acquisition Cost, or CAC, measures the overall cost of acquiring a new Customer. Depending on the organization’s methodology, CAC may include both Marketing and Sales costs rather than Advertising Spend alone. CAC should be considered alongside Revenue, Customer Value and Margin when evaluating the economics of Customer Acquisition.
15. Return on Ad Spend (ROAS)
Return on Ad Spend, or ROAS, compares Revenue generated with Advertising Spend. It is particularly useful when Revenue can be reliably connected back to Advertising Campaigns.
For Lead Generation Campaigns where a purchase does not happen immediately, marketers may need CRM and Sales Data to connect the journey from Lead to Customer and ultimately to Revenue before evaluating ROAS accurately.
What Are the Key Lead Quality Metrics?
Lead Quality Metrics help answer a fundamental question: Are the Leads generated by the Campaign actually valuable to the business?
Key Metrics include:
- Qualified Lead Rate
- Cost per Qualified Lead
- Lead-to-Customer Rate
- Customer Acquisition Cost
A useful framework is to analyze Lead Generation at three levels:
Lead Volume, Lead Quality, and Business Outcome
For Website Lead Generation, Google Analytics can be used to identify meaningful user actions as Key Events and analyze the paths leading to those actions. CRM data can then provide information about what happens after the Lead is generated, including qualification and Customer Conversion.

Which Meta Ads Metrics Should You Look at First?
When reviewing meta ads metrics, marketers should prioritize indicators that reveal efficiency and lead value. A practical evaluation hierarchy starts with reach and cost before assessing downstream lead quality:
Spend, Leads, CPL, Lead Quality, Customer Conversion, and CAC/ROAS
First, review how much the Campaign spent and how many Leads it generated. Then evaluate CPL, followed by Qualified Lead Rate and CPQL. Finally, examine Customer Conversion and Business Outcomes.
The most important Metric depends on the Campaign Objective. An Awareness Campaign may focus more heavily on Reach and Impressions, while a Lead Generation Campaign may prioritize Leads, CPL and Lead Quality. Campaigns connected directly to Revenue may also require CAC and ROAS.
Which Meta Ads Metrics Should Not Be Analyzed Alone?
Many Meta Ads Metrics become more useful when analyzed together:
- CTR + CPC: Shows the relationship between engagement and click cost.
- Leads + CPL: Shows Lead Volume and acquisition cost.
- CPL + Qualified Lead Rate: Shows whether low Lead Cost comes with acceptable Lead Quality.
- Leads + Lead-to-Customer Rate: Shows whether Lead Volume contributes to Customer Growth.
- CAC + ROAS: Connects Customer Acquisition Cost with Revenue.
For example, one Campaign may produce a high CTR and low CPL but generate few Qualified Leads. Another may have a higher CPL but produce more Qualified Leads and Customers. This is why CPL should be interpreted within the wider Lead Generation Funnel.
Meta Ads Funnel Metrics for Lead Generation
A Funnel-based approach helps marketers identify where Performance drops between ad exposure and Customer Conversion:
Impression, Click, Lead, Qualified Lead, and Customer
Each stage can be connected to specific Metrics:
- Awareness: Impressions, Reach, Frequency
- Interest: CTR, CPC
- Lead Generation: Leads, Conversion Rate, CPL
- Lead Quality: Qualified Leads, Qualified Lead Rate, CPQL
- Sales: Lead-to-Customer Rate, Cost per Customer, CAC
- Revenue: ROAS and Revenue
If Impressions and CTR are strong but Leads are low, the Conversion Experience may require investigation. If Leads are high but Qualified Leads are low, marketers may need to review Audience, Creative, Offer, Form or Lead Qualification Criteria.
For Website Lead Generation, Events and Key Events in Google Analytics can also be used to measure important actions such as Lead Form submissions and analyze the paths leading to those actions.
Meta Ads Lead Generation Metrics for B2B
B2B Lead Generation often involves longer Sales Cycles and multiple stages between the initial Lead and a Customer. As a result, CPL alone may not provide enough information to evaluate Campaign Performance.
Important B2B Metrics can include:
- Qualified Leads
- MQL
- SQL
- Lead-to-Opportunity Rate
- Opportunity-to-Customer Rate
- Customer Acquisition Cost
- Pipeline
- Revenue
The most useful approach is to connect Meta Ads Data with CRM Data so marketers can identify which Campaigns, Audiences and Creatives generate Leads that actually progress through the Sales Pipeline.
For Website Campaigns, important user actions should also be clearly defined and tracked. Attribution settings matter because an attribution model determines how credit is assigned across different Touchpoints before a Key Event occurs. In Google Analytics, attribution can be used to analyze how different Touchpoints contribute to important user actions.
Meta Lead Ads vs. Website Lead Generation: Which Metrics Are Different?
Meta Lead Ads and Website Lead Generation use different Conversion Experiences, so the Metrics should be interpreted accordingly.
With Meta Lead Ads, users submit information through a Lead Form within the Meta environment. With Website Lead Generation, users are directed to a Landing Page or Website where they complete a Form.
Meta Lead Ads can be evaluated using Leads, CPL, Qualified Lead Rate and CPQL. Website Lead Generation may require additional Metrics such as Landing Page Conversion Rate, Form Start Rate and Form Completion Rate.
Comparing CPL alone between the two approaches can therefore be misleading. Marketers should also compare Qualified Lead Rate, Lead-to-Customer Rate and CAC.
Why Can a Low CPL Still Mean a Failed Campaign?
A low CPL does not necessarily mean that a Lead Generation Campaign is successful.
A Campaign may generate Leads at a low cost because it produces a large volume of low-quality submissions. Sales may then find that many Leads are outside the Target Audience, cannot be contacted or have limited purchase intent.
For this reason, marketers should analyze:
CPL + Qualified Lead Rate + CPQL + Lead-to-Customer Rate + Cost per Customer
This combination provides a clearer view of whether low Lead Cost is actually translating into valuable business outcomes.

How to Set KPIs for Meta Ads Lead Generation
The right Meta Ads Metrics can help businesses turn Business Goals into measurable KPIs and evaluate whether Campaign Performance is contributing to Sales outcomes. KPI setting should begin with the Business Goal, not with a single industry benchmark.
A practical process is:
- Define the Business Goal.
- Define what qualifies as a Qualified Lead.
- Review Historical Campaign Data.
- Set targets for CPL and Conversion Rate.
- Add Lead Quality KPIs such as Qualified Lead Rate and CPQL.
- Connect Marketing KPIs to Sales Metrics such as Lead-to-Customer Rate and CAC.
- Review the targets based on actual Performance and Sales Cycle.
There is no universal CPL target that applies to every business. Industry, Audience, Competition, Offer, Customer Value and Business Model can all influence acceptable acquisition costs.
How to Build a Meta Ads Dashboard for Lead Generation
A Meta Ads Dashboard should provide a clear view from Ad Performance to Sales Outcomes.
- Ad Performance Track Spend, Impressions, Reach, Frequency, CTR and CPC.
- Lead Generation Track Leads, Conversion Rate and CPL.
- Lead Quality Track Qualified Leads, Qualified Lead Rate and CPQL.
- Sales and Business Outcomes Track Customers, Lead-to-Customer Rate, Cost per Customer, CAC and ROAS.
For B2B, CRM integration is particularly important because Meta Ads data alone may not show whether a Lead became an MQL, SQL, Opportunity or Customer.
For Website Lead Generation, Google Analytics can also be used to track Key Events and analyze Attribution Paths. Google Analytics allows marketers to evaluate how different Touchpoints contribute to important user actions and how different attribution models distribute credit.
7 Common Meta Ads Lead Gen Mistakes Marketers Make
- Looking Only at CPL: CPL is useful, but it does not measure Lead Quality or Customer Conversion on its own.
- Prioritizing Lead Volume Over Lead Quality: A large number of Leads does not necessarily mean more Sales. Qualified Lead Criteria should be defined before Campaign Performance is evaluated.
- Ignoring the Funnel: Looking only at the top of the Funnel can hide Conversion Drop-offs between Click, Lead, Qualified Lead and Customer.
- Using the Same KPI for Every Campaign: Awareness, Lead Generation and Revenue Campaigns can have different Objectives and should therefore use KPIs that reflect those Objectives.
- Not Connecting Advertising Data with CRM: Without downstream Sales Data, marketers may not know which Campaigns generate Leads that actually progress through the Sales Process.
- Making Decisions Based Only on Short-Term Data: Short-term Performance may not fully reflect Lead Quality, especially for B2B Campaigns with longer Sales Cycles.
- Not Separating Campaign, Audience and Creative Performance: Differences in Performance can come from Campaign Structure, Audience or Creative. Analyzing these elements separately can provide a more useful view of what is driving results.
Conclusion
Meta ads metrics for lead generation should not be measured by lead volume or CPL alone. A robust tracking system evaluates top-of-funnel metrics like Impressions, Reach, CTR, and CPC alongside key conversion metrics. Incorporating meta ads kpis such as Qualified Lead Rate and CPQL ensures ad spend drives genuine pipeline value.
The analysis should then connect with Sales Metrics such as Lead-to-Customer Rate, Cost per Customer and CAC. When Revenue Data can be reliably connected to Advertising Data, ROAS can provide an additional view of Business Performance.
For B2B Lead Generation, CRM integration is particularly important because the value of a Lead may only become clear after it moves through MQL, SQL, Opportunity and Customer stages.
If you are looking for support with Facebook Ads, Minimice Group provides Facebook Ads services covering Campaign Strategy, Audience and Creative Planning, Performance Analysis and optimization aligned with broader Business Goals.
FAQs
What are the most important Meta Ads metrics for lead generation?
Key Meta Ads Metrics include CTR, CPC, Leads, Conversion Rate and CPL. To measure Lead Quality, also track Qualified Lead Rate, CPQL and Lead-to-Customer Rate.
What is a good CPL for Meta Lead Ads?
There is no universal CPL benchmark that is good for every business. The appropriate target depends on factors such as Industry, Audience, Competition, Offer and Lead Value. CPL should also be evaluated alongside Lead Quality and Customer Conversion.
Which Meta Ads metrics measure lead quality?
Qualified Lead Rate, Cost per Qualified Lead and Lead-to-Customer Rate are useful Metrics for evaluating Lead Quality. Businesses should define Qualified Leads using criteria that match their Sales Process.
Why is my CPL low but lead quality poor?
A low CPL can occur when a Campaign generates a large volume of Leads that do not match the Target Audience or have sufficient purchase intent. Review Qualified Lead Rate, CPQL, Lead-to-Customer Rate and Cost per Customer.
How do I measure B2B lead generation on Meta Ads?
Track CPL, Qualified Leads, MQL, SQL, Lead-to-Opportunity Rate, Opportunity-to-Customer Rate and CAC. Connecting Meta Ads Data with a CRM can help identify which Campaigns generate Leads that progress through the Sales Pipeline.
What is the difference between Meta Lead Ads and website lead generation?
Meta Lead Ads allow users to submit information through a Lead Form within Meta, while Website Lead Generation sends users to a Landing Page or Website. Metrics such as Form Completion Rate and Landing Page Conversion Rate are particularly relevant to Website Lead Generation.